

If you lead marketing at a credit union, you are not short on data. Your analytics platform, your core, your marketing automation tools, and your website all produce more of it than any team has time to read. The harder question is the one data alone never answers: compared to what?
Say your homepage bounce rate is 42 percent. Is that good? Say your site loads in three seconds. Is that fast enough for the members you serve, or the ones you hope to win? Without context, every number on your dashboard is a fact in search of a meaning.
That question is why we built Credit Union Insights, an application that benchmarks the websites and financial performance of every credit union in the US against their peers. It is also the reason behind version 2.0, now in closed beta.
Credit unions had no reliable way to compare themselves to peers
COLAB has worked alongside credit unions for years, and a pattern kept surfacing in that work. Each credit union understood its own website well. Almost none had a reliable way to see how it stacked up against peers, whether that meant the credit union across town or institutions of a similar size three states away.
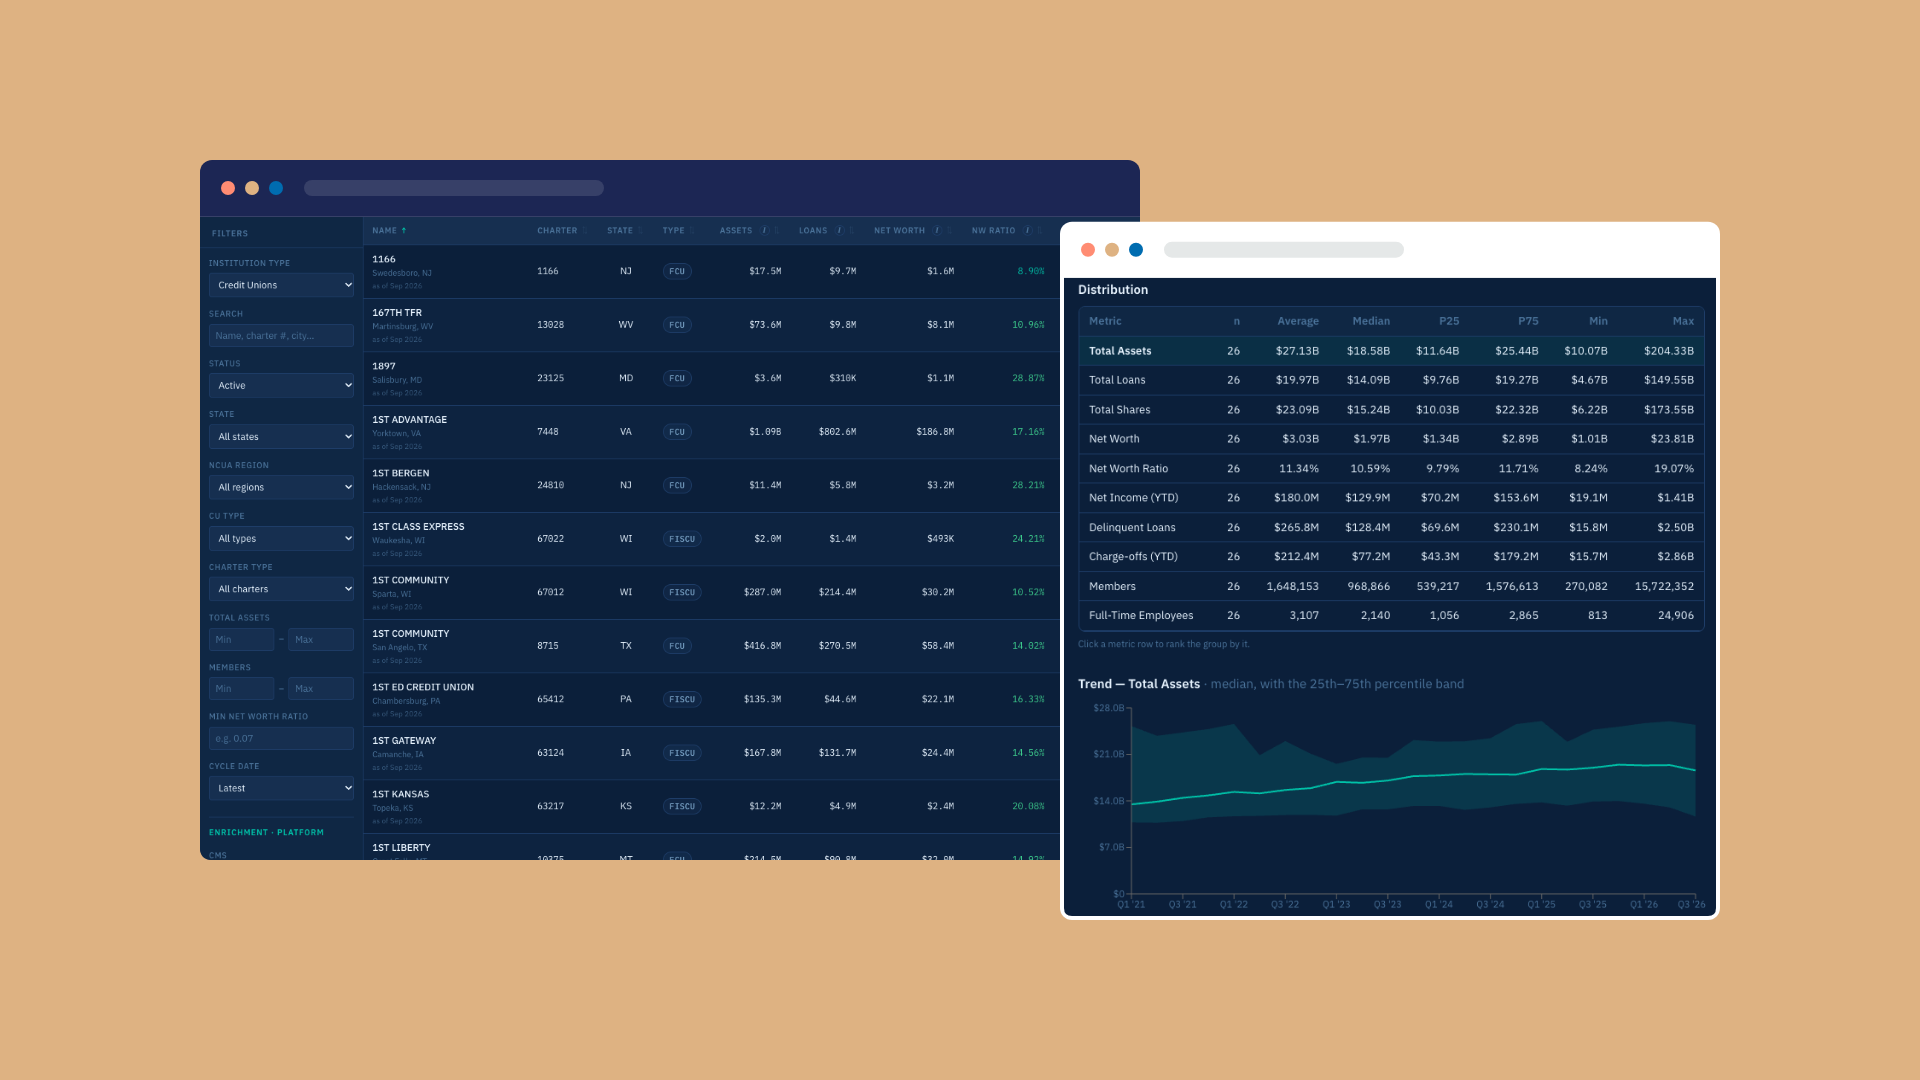
So we started building that view ourselves. Credit Union Insights combines five years of NCUA call report data for every credit union in the US with website data we collect, all in one interface. A keyword search and more than 20 filters show how credit unions compare as a group and how any one credit union measures against its competitors.
Version 1.0 was our first attempt at turning that idea into a working application. It let us draw insights from credit union websites, and just as important, it showed us what we could learn easily and where the harder work would be. We used it in client conversations and in our own strategy work, and we paid attention to what it got right and where it fell short.
Version 2.0 is a rewrite that measures more of each credit union
Version 2.0 is a complete rewrite. It runs faster than 1.0, and it is the first version credit union teams outside COLAB can use.
On the website side, 2.0 tracks each credit union’s site performance, accessibility, and the technology behind it, including the content management system and connected services. It also records the files that tell search engines and AI tools how to read a site (robots.txt, llms.txt, and the XML sitemap), a topic we covered in our AI visibility audit of a credit union site, and it logs content changes over time.
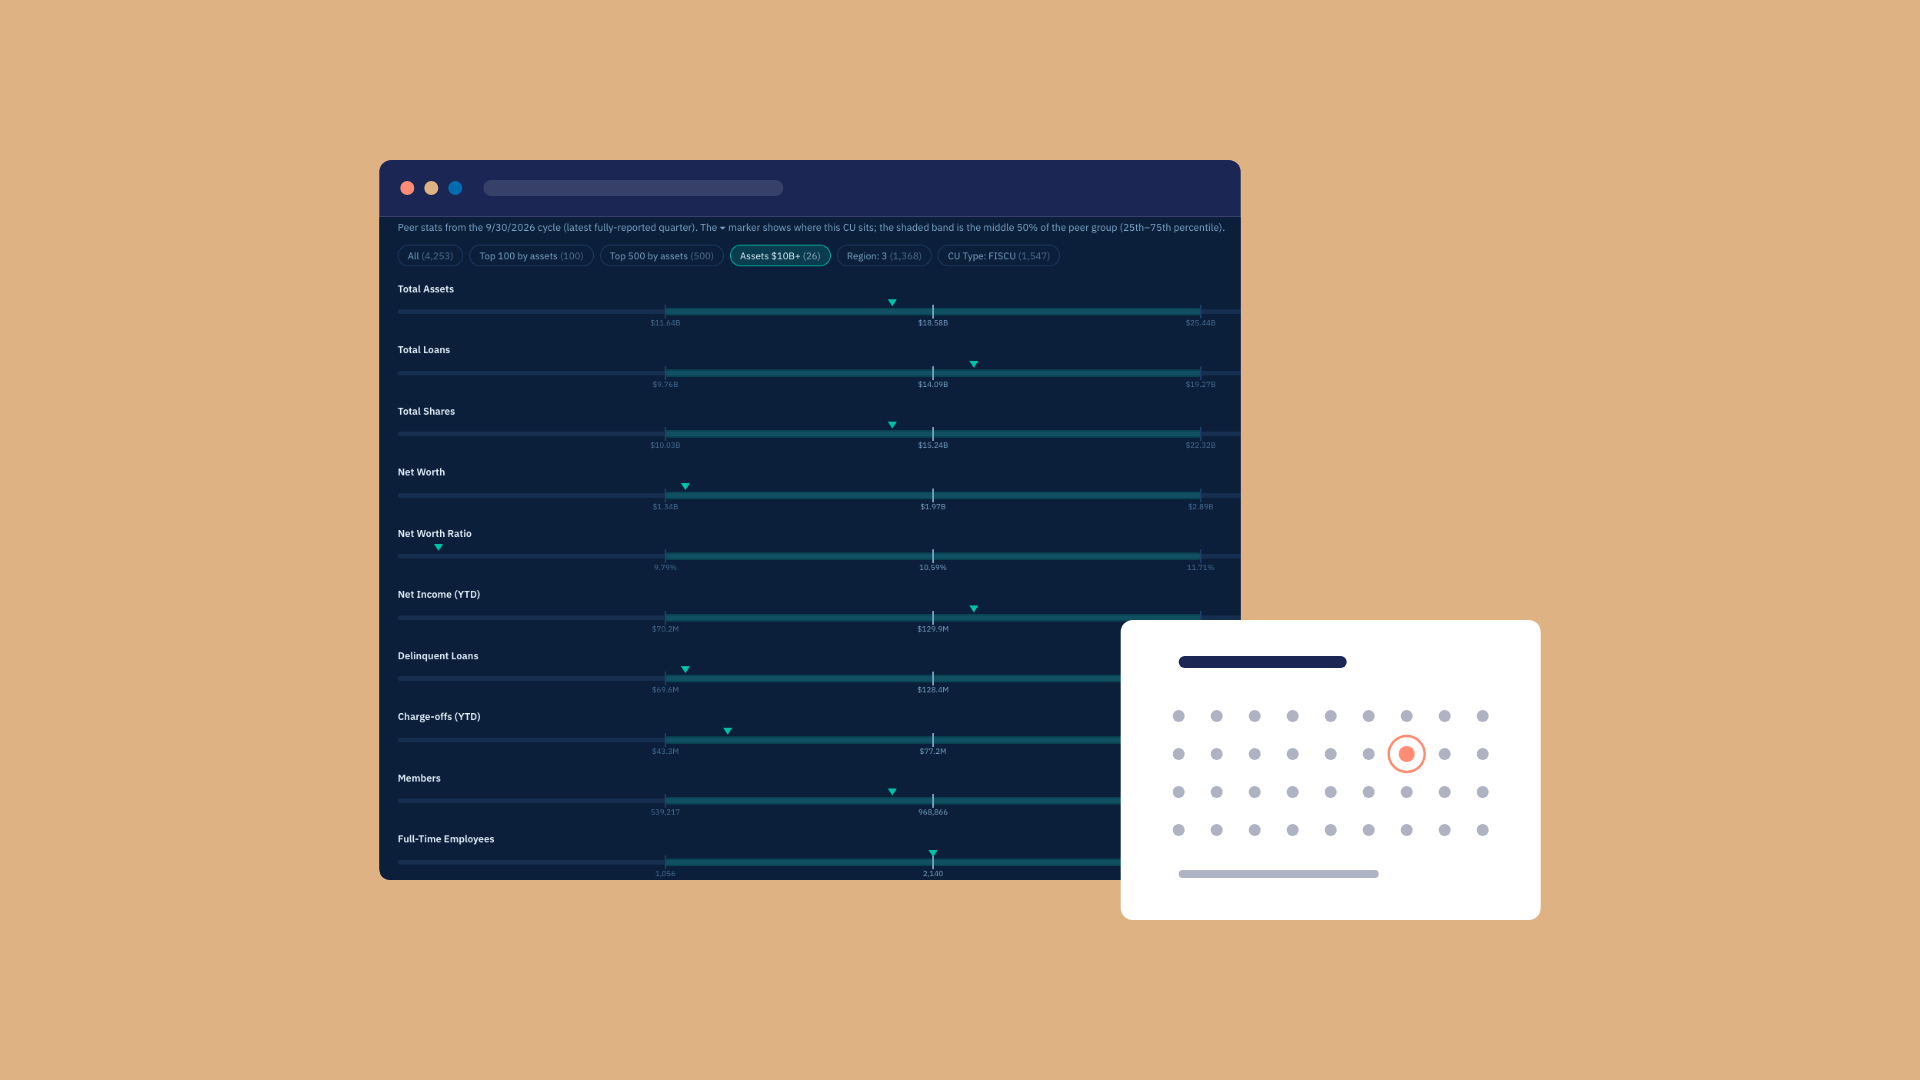
On the financial side, five years of call report data sit behind distribution charts for each metric. You can place a credit union among all credit unions, the top 100 or top 500 by assets, its asset bracket, its region, or its credit union type, and rank each grouping by assets or by membership.
None of this comes from client data. Call reports are public, and COLAB gathers the website data using the same method for every credit union in the country. That consistency keeps the comparisons fair, and it supports trend analysis across the industry: where credit unions stand today and how that has moved over time. We have not found another source that puts these views side by side.
Three questions a credit union benchmarking tool should answer
Benchmarks are useful when they change a decision. For a credit union marketing team, that usually comes down to three questions.
How does our site perform against our competitors? Compare it against the specific credit unions your members and prospects also consider. Filter to the institutions you care about and see where you lead and where you trail.
What is the rest of the industry doing that we are not? Look at technology choices, performance, and patterns in how sites are built across hundreds of credit unions. When many of them start moving in one direction, you want to know before you scope your next redesign.
Where should we invest next? When you can see which gaps separate you from peers and which are industry-wide, prioritizing gets easier. Some problems are yours to fix. Others are an opportunity, because nobody has fixed them yet.
We use the application the same way in our own client work, to ground recommendations in what the data shows across the industry. Our credit union work includes a website rebuild that increased leads by 32 percent for a statewide credit union and a redesign that lifted loan applications by 26 percent.
What counts is what you do with the data
Everyone has data now. Vendors sell it, platforms surface it, and every conference session promises to be data-driven. Access is no longer what sets a team apart.
What counts is what you do with it. A benchmark matters when it informs a budget conversation, a redesign scope, or a board presentation. A trend matters when you act on it while it is still a trend. The work of turning numbers into decisions still belongs to people who understand credit unions, their members, and the responsibility that comes with both.
That was the standard for 2.0: fewer steps between a number on the screen and a decision, for the people who make those calls.
See how your credit union compares
If you would like to see how your credit union measures against its peers and competitors, request a walkthrough. We will take you through the application using your institution’s data.